AI is fascinating, but most organizations don’t have the magnitude of data or the skills to effectively leverage it.
Watching Qlik’s Qonnections 2018 keynote yesterday opened my eyes to a new application of ai. Qlik claimed that Qonnections was the largest data analytics conference in the world. Not sure about that one, but their existing 45,000 customers is hard to argue. Their CEO make some interesting claims, that 10 of the 10 largest pharma companies use Qlik, along with an impressive list of the top 10 companies across several leading industries.
The progression is always like this: data -> analytics -> insights. I’ve heard it many ways from many suppliers, but the two biggest hurdles with data are always the same. Gathering high-quality data is difficult. There are lots of tools for display once clean data is available. Regardless of the quality of the tools, deriving actionable insights is tricky.
It all starts with data literacy and a data-centric culture.
Qlik’s director of research presented their soon to be released “Cognitive Engine”. The highlight of the cognitive engine is their clever use of AI. With Qlik’s new technology, a researcher can visually drill into apparent anomalies in the data, and Cognitive Engine’s AI will proactively identify statistically significant variances worth exploring.
This, to me, was fascinating. It was clearly one of the quickest and easiest ways a data-centric organization could start to leverage AI.
One of the highlights of attending the GPU Technology Conference in San Jose back in March was the keynote address by NVIDIA CEO Jensen Huang. Of course, there was the predictable push to sell more hardware, but notwithstanding the technology demonstrations were truly impressive.
There was an autonomous car in the parking lot. There was a driver in the conference room. Then, on the big screen, was the driver in the holodeck – the simulated environment for the real car out back. The real driver, in the virtual holodeck, seeing real-time data and imagery, drove the virtual car, which in turn drove the physical car safely into a parking spot. It was impressive. The processing power required to do this all real-time is barely imaginable.
But the biggest insight for me came from NVIDIA’s Director of Developer Programs, William Ramey.
AI is not Magic.
With all the mystery around Machine Learning and Deep Learning in particular, it was insightful to hear such a thing. The problem, of course, is that the hype is so great. It’s easy to assume that because this problem is hard, AI must be the answer.
His statement boiled down to this: If X then Y. Can the problem be defined so simply? Can a human understand, at least conceptually, the process? Is there a defined outcome? If all are true, then AI is likely a viable candidate. If a human can’t articulate the process, then don’t expect AI to provide an answer.
Ultimately it boils down to this: Could a human, with a lot of data and a lot of time, solve this same problem? If not, don’t expect magic from AI.
Amazon’s webinar today highlighted several ways that Big Data is being used in the HCLS industry. One of the key insights was the self-realization within one of the featured medical practices that they were “data rich, insight poor.” Having tremendous amounts of data isn’t much value to anyone without the appropriate tools and skills to visualize, interact and explore the data, which of course needs to be coupled with people who are empowered to act on the insights revealed.
Several of the tools demonstrated seemed to use Shiny and R to create interactive graphics. This is a perfect combination of developer skills preparing the right kind of visualizations so that self-service data exploration becomes meaningful. So many self-service reporting tools end up being huge time sinks because the fundamental data organization was incomplete or inconsistent.
One of the featured labs highlighted how expenses were reduced and customer satisfaction increased by the appropriate use of dashboards and educated data exploration. They were able to reduce repetitive testing and quickly identify trends in unreimbursed testing. Then with data at their fingertips they were able to discuss the trade-offs between economic and medical goals.
It makes me cringe when I hear people talk about investing in cryptocurrency.
I have been successfully investing for 25+ years. This involves understanding fundamentals, having a general awareness of the economy while committing to a lot of safe principles like asset allocation, dollar cost averaging, long term perspectives and, most importantly, a disciplined selling strategy.
In short, I am an investor, not a trader.
Bitcoin’s recent tumble is largely related to regulatory concerns and Google’s ban on advertising.
I view cryptocurrencies as a massive social experiment with the fundamental value propositions still developing. Clearly there is tremendous hype. Beyond the hype, there are stories of people in high-inflation countries exchanging their local fiat currency for crypto as quickly as possible to preserve value. In a geopolitical culture of growing mistrust of governments and institutions, the immutable and pseudonymous transparency of the blockchain, unable to be stopped by a single entity, is compelling.
Bitcoin, presently, is useless as a currency. Why would someone want to spend $30,000 on a car today when that same car could be worth $50,000, or $17,000, tomorrow? Currencies need stability and trust to be useful. Most cryptocurrencies have neither right now.
However, I do like data, big data, AI, and algorithms. The massive price swings, the changes in sentiment, the lack of fundamentals, the 24×7 trading platform and the involvement of tech all make cryptocurrencies compelling to my inner engineer. There is a tremendous amount of raw data available. It all has to be organized and mined.
The euphoria and incredible volatility create a perfect environment for quants trading.
I decided to programmatically trade in the most reputable cryptocurrencies. The first problem was choosing an exchange, and did I want to hold long positions only, or also short positions and do margin trading?
The reputable cryptocurrency exchanges in the U.S. are all regulated, and, thankfully, that means there is some difficulty in shorting Bitcoin.
Most platforms for margin trading, shorting, and derivative trading of cryptocurrencies are not readily available to U.S. investors. Avatrade, BitMEX, IQ Option and Plus500 appear the be the most reputable, but a foreign bank account is required to trade on these platforms and that’s well beyond the effort level that most people desire.
In the U.S., cryptocurrency margin trading can be done at Bitfinix and LedgerX, though you must be an accredited investor to do so. If you don’t know what that means, you aren’t.
The two safest options for trading cryptocurrency in the U.S. appear to be Coinbase’s GDAX and Kraken. GDAX suspended all margin trading for non-grandfathered accounts in late 2017. Kraken appears to be the only platform in the U.S. for regular people to trade cryptocurrency on margin and has a reputation for excellence along with security, though was plagued with technical problems during Bitcoin’s astronomical December rise (possibly now resolved).
For safety and clear and obvious compliance with U.S regulators, I’ve chosen to stay with GDAX, and forego margin trading until the market stabilizes.
If you are still interested in shorting Bitcoin, check out:
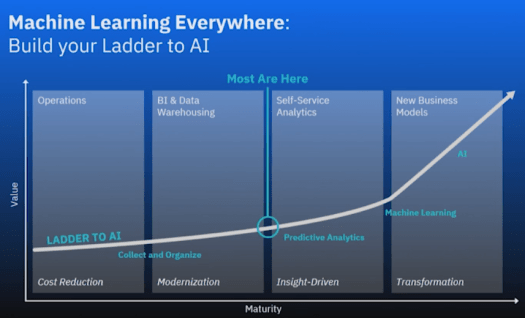
Today I joined IBM’s Machine Learning Everywhere: Build Your Ladder to AI webinar to hear about some of the latest trends in adopting Machine Learning into an organization, and of course plugs for several of IBM’s products in that space.
Rob Thomas is General Manager of Analytics at IBM. His main topic was that there is a ladder that must be climbed for the effective use of Machine Learning and Artificial Intelligence. Per Rob, the technology has finally caught up and “2018 is the year to implement Machine Learning.” Part of that is instilling a data-driven culture.
The first rung is that AI is not possible if your data is not simplified and collected into a data lake. Traditional business analytics with a solid data strategy is essentially the prerequisite for a shift into ML. As part of this, the point was made that AI is perceived is being only for hyper-scaling big players like Uber, Airbnb and Facebook but that recent advancements really make it available to all. An insight that really resonated with me was that 80% of the world’s data is sitting unused and neglected behind corporate firewalls.
The second rung is that data must be accessible. Policy and governance must be in place so that data is at the fingertips of the users that need it most. Of course, there are complications with financial data and HIPPA protected data. The idea is to install the data driven culture by making as much data available to anyone who needs it in a self-service manner.
The top rung is built upon traditional analytics and business intelligence—the actual utilization of Machine Learning in every decision. Once data is widely accessible, decisions based on hunches become less viable and people learn to interact with their data using ever more sophisticated tools. This is the destination of all successful companies in the future: data driven decision making.
Rob mentioned the 40/40/20 rule about companies adopting a data driven culture:
Stage 1: 40% are data aware and are building out incremental efficiencies in their data processing, using both proprietary and open-source tools to create their data lakes. Data collection and data cleansing are the current investments.
Stage 2: 40% are actively examining their data looking for new ways to grow. Regardless of their actual industry, they are becoming a technology company.
Stage 3: 20% are exploring Machine Learning with the intention of being data led. It’s the end of opinions. They are evolving to use ML to automate tasks they never wanted to do in the first place.
Vitaly Tsivin of AMC Networks and Alissa Hess of USAA both shared examples of how Machine Learning and data science are being used to transform their companies from the inside out. However, both noted that the biggest barrier to success is finding talent. The combination of understanding data, understanding technology, and understanding business is rare in a person and difficult to hire.
The webinar ended with a presentation by Garry Kasparov, the first chess grand master to be defeated by a computer, and his opinions on the limitations and direction of artificial intelligence.
The seminar was an intensive on Structured Problem Solving, which I think is a term created by professor Patrick Noonan. A book may be in the works. I certainly hope so as there was tremendous wisdom and experience packed into these two days. Referring to the slide deck will help, but not the same way a comprehensive book would.
So what is Structured Problem Solving? It is a way to identify the real issue and then methodically move through various steps including research, task identification and communication, ultimately resulting in action. Be sure to keep the end goal in mind. Anyone who loves data understands that looking for other insights “just because” can waste a tremendous amount of time. That extra effort may be interesting but may not be aligned with the immediate needs of the company or customer. We had a great conversation about scope creep—and how that can come from both the requestor and from the team doing the work.
The high-level steps of Structured Problem Solving are:
Define the Problem
Break Down the Problem
Plan the Work
Work the Plan
Build the Case
Tell the Story
Start the Change
I have been in charge of software development teams of various size for over 20 years, including internal developers and outsourced teams. During that time, I’ve seen requirements and management styles shift from Waterfall to Agile. SPS is especially enticing to me as the advantages of Agile and iterative methodologies have become so apparent on so many projects. Each one of the steps above is tackled by a team in an iterative process and then refined or worked individually. Every team member understands the big picture, and every team member understands how their part fits into the whole. The final product truly is a gestalt.
Structure Problem Solving is a technique I intend to use both personally and professionally to bring clarity of thought and process to non-trivial tasks.
There were two other major highlights of the day. The first was on data visualization. As the actions should be based on logic and facts, they should be natural conclusions of the research. The question always is how can the data be presented with both the least cognitive load and the most clarity—especially when the results are being presented to non-technical people. Several examples of poorly chosen graphics were studied and better options discussed. Of course, the works of Edward Tufte’s The Visual Display of Quantitative Information and Stephen Kosslyn’s Clear and to the Point: 8 Psychological Principles for Compelling PowerPoint Presentations were referenced and highlighted in many ways.
The second major highlight was the time we spent discussing creativity. Some people in the room had practice with structured creativity while the concept was new to others. I have used Brainstorming and Devil’s Advocate approaches effectively for years. The concepts of Brainsteering and Six Thinking Hats were both new to me. The bottom line: creative insight doesn’t happen accidentally. Creative insight happens within the context of intentionally focused thinking.
This course will definitely change my management style for years to come.
Today I met Emory University professor Patrick Noonan at the INFORMS seminar on Essential Practice Skills for High-Impact Analytics Projects. The day included many great gems that will guide some thought processes for years to come, but an early idea was about the new nature of work and that businesses need to “figure it out as we go.” The underlying assumption is that business practices and advancements in data collection and analytics are changing at such a rapid pace that there is really no opportunity to rely on prior techniques. Of course, that’s not universally true—there are many situations where our skills and experiences are directly applicable so that some problems can be solved quickly. However, there are many complex business questions that have never before been answerable as the data and tools required to answer them did not exist. This is new territory.
The bulk of today’s discussion was about decision making processes and how to formulate a plan to answer key questions based on analytics. The advantages and limitations of existing frameworks such as SWOT and SMART were discussed, and how their inherent limitations naturally lead to the use of Issue Trees. What is the Key Question to be asked? Because the first step in the process is always situation specific, this becomes a highly customized process instead of a generic framework. Once the Key Question is agreed upon by key stakeholders, a plan of attack can be developed.
The most interesting exercise today was generating a task list from terminal questions based on the Issue Tree. After formulating the questions, we collectively created Proto-Graphs. I don’t know if Proto-Graphs is a Noonan invented term or borrowed from someplace else. Proto-Graphs are sample layouts of graphs that should be created by the data team to help answer the Key Question. The creation of these Proto-Graphs led to a significant amount of disambiguation. e.g., would a scatter plot or a histogram best represent the data? What time frame should be analyzed? What units are expected? It was surprising to me how many of the “obvious” assumptions were made differently by different team members. The process clarified the result before the expense of creating the graphic with real data was incurred. Another advantage was that our paper sketches were not dependent on the capabilities of any specific tool—our sample visualizations were not guided by what can be done. All of my new data visualization projects will use this technique.
We also discussed how to clarify the Key Question. A highlight of my day was when Professor Noonan asked to use one of my quotes. We were defining ideas to clarify the Key Question and I said that it was essential to ensure that everyone understood the true goal. When asked about this, I replied that “our biggest failures at Blue Ridge Solutions were when we delivered what the client asked for.” What’s that mean? Often in the rush to get something done, business requests are made from a starting assumption of let’s move quickly. Failure to investigate the true goal often leads to the wrong deliverable.
I’m headed out to this conference in March. Will be great to revisit my old stomping ground. It would take about an hour but I used to walk to the convention center.
But the important part—hearing about the latest innovations in AI, Analytics and Cryptocurrency and meeting industry influencers.
From the conference web page…
The world’s biggest and most important GPU developer conference. Learn how to harness the latest GPU technology. Enjoy face-to-face interactions with industry luminaries and NVIDIA experts.
Very excited to be attending this conference in February!
From the conference web page…
Learn practical frameworks and systematic processes for addressing complex, real-world problems and how to facilitate effective action. This intensive hands-on course is developed by the largest organization of analytics professionals, INFORMS.